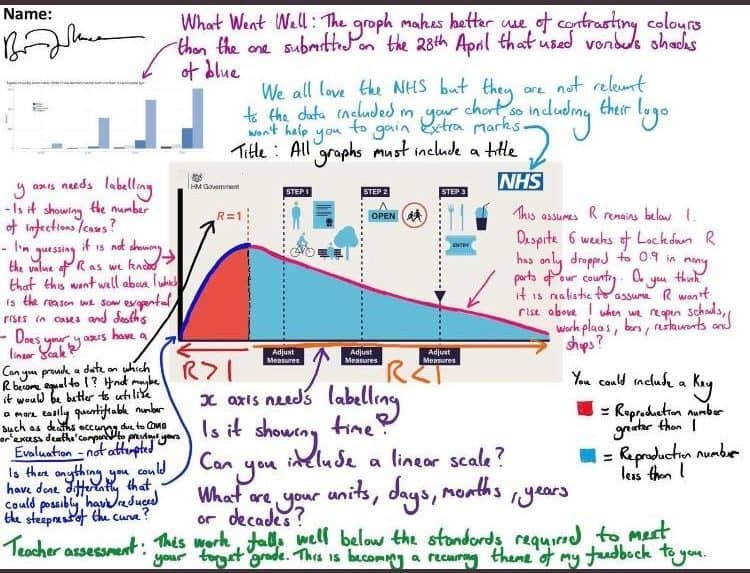
A school teacher has given an honest and brazen assessment of the government’s lockdown chart, saying the graph “falls well below the standards required”.
Trisha Greenhalgh, a Professor of Primary Care at the University of Oxford, tweeted a picture from a teacher friend showing a marked version of the chart.
In it, they said much of the workings assume R will remain below 1 despite it only dropping to 0.9 after six weeks of lockdown.
“Do you think it is realistic to assume R won’t rise above 1 when we reopen schools, workplaces, bars, restaurants and shops?”
They also called for the X and y axis to be labelled, a title to be added and a key to be included before subtly suggesting that an evaluation was not attempted.
“Is there anything you could have done differently that could possibly have reduced the steepness of the curve?”, it asked.
The teachers assessment read as follows:
“This work falls well below the standards required to meet your target grade. This is becoming a recurring theme of my feedback to you.”
Related: Ken Loach exclusive – PM’s new found love for NHS is ‘rank hypocrisy’