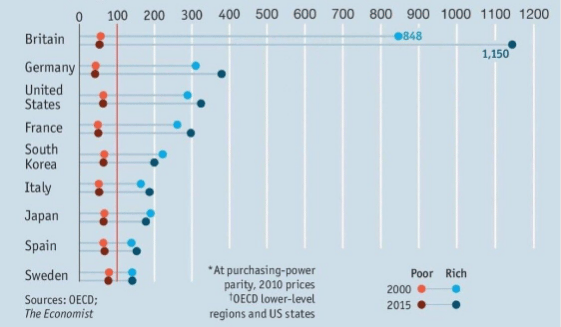
The level of inequality in Britain far outstretches that of our European neighbours or other G7 countries, a new graph has revealed.
According to OECD figures published in The Economist the richest people in the UK are leaps and bounds ahead of the poorest groups in terms of GDP per person.
The figures were revealed as Jeremy Corbyn piled pressure on Theresa May in today’s PMQs for allowing the UK to become a tax haven for the rich.
The disproportionate amount of income earned by the top one per cent in Britain is quite terrifying when compared to that of other nations.
But it becomes even more worrying when you look segment that group even further.
Although the top one per cent have an average income of £253,927, according to the latest figures, the top 0.1 per cent have an average income of £919,882.
RELATED
https://www.thelondoneconomic.com/news/higher-income-tax-rates-rich-reduce-inequality-without-impacting-economic-growth/11/10/