credit;PA
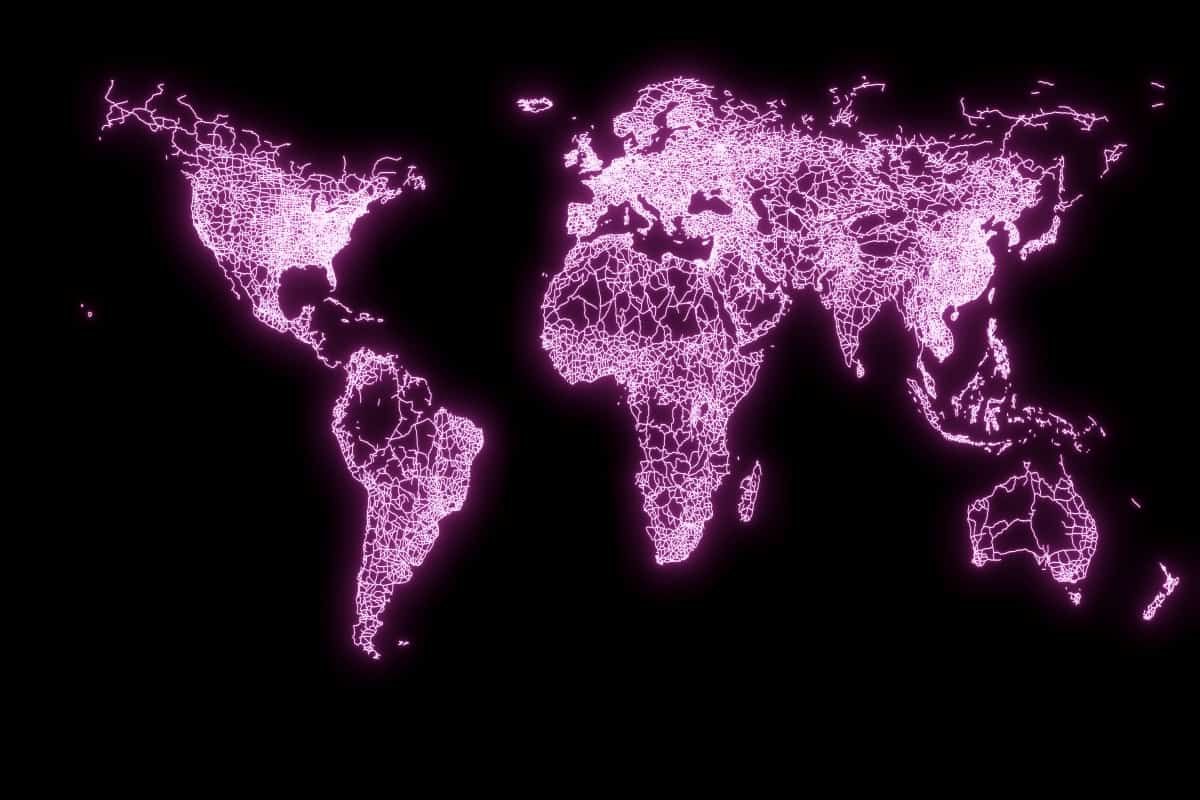
These maps show the world’s infrastructure in a different light – using electrifying patterns to connect roads, rail roads and cities.
Graphic designer Peter Atwood, 23, spent three days doing research into a variety of data sources to show the maps “which connect our world.”
These pictures show the United Kingdom and “the rest of the world in a different perspective” as it uses light to show where humans have built structures.
Peter will collected information from Natural Earth Data and plot each different point on a map with a black and white “mask” which then generates a light-source.
Peter, from Nova Scotia, Canada said: “I find it immensely satisfying to be able to watch patterns emerge as I work with data and gain a better understanding of the world I live in.
“While most ‘normal’ maps tend to show many types of information for example the natural landscape, political boundaries etc.
“These series of maps shows only one type of information – the urban areas of the world.
“By separating each type of infrastructure into a different map I hope it allows people to see patterns and connections that they might not see otherwise.”
Cartography fan Peter has used a 3D modelling and animation programme to emit light onto the maps to help form a glow in these striking pictures.
Peter, a graduate student studying archaeology, relies on governments to report and collect data accurately.
He added: “The hardest part about this is that there is a lot of trial and error to figure out how to achieve the visual effect that I was looking for.
“Every project I start always raises a dozen new questions and gives me many new avenues to explore.
“I try not to inject my projects with too much meaning or political agenda.
“One person might see these maps as evidence of the damage humans are doing to the planet, while another person might see this as a testament to how interconnected we are as a species and the remarkable achievements that we have made.”
Peter has currently created a global and UK map but plans to explore other parts of the world using the same technique.
He added: “It’s been incredibly shocking and gratifying to see the massively positive reaction that I’ve gotten for my designs over the past few months.
“I have a love for information and coming up with ways to share that information with others.”

